Support #1097
open
YPDKLM: irregular variable dist.
Added by Amy Orben over 7 years ago.
Updated over 3 years ago.
Category:
Data inconsistency
Description
Dear US team,
I have recently started working with the alcohol consumption variables you provide in the youth self-completion questionnaire. Graphing the distribution of ypdklm, I found that the variable is distributed in a very irregular way. The questionnaires show that the question has 5 different response options. But in 2010, 2012 and 2014 the data shows 6 different response options, while in 2009, 2011, 2013 and 2015 the data shows 5 different response options. I include the histogram as an attachment in this email.
Could you please provide me with some clarification?
Thanks,
Amy
Files
- Category set to Data inconsistency
- Status changed from New to In Progress
- Assignee set to Stephanie Auty
- Target version set to X M
- % Done changed from 0 to 10
- Private changed from Yes to No
Many thanks for your enquiry. The Understanding Society team is looking into it and we will get back to you as soon as we can.
Best wishes,
Stephanie Auty - Understanding Society User Support Officer
- Status changed from In Progress to Feedback
- Assignee changed from Stephanie Auty to Amy Orben
- % Done changed from 10 to 80
Dear Amy,
If you look at the value labels you will see that the sixth response option is labeled "never but q45 answered". e.g. https://www.understandingsociety.ac.uk/documentation/mainstage/dataset-documentation/wave/2/datafile/b_youth/variable/b_ypdklm
Then, looking at the questionnaire you can see that q45, yp5alcdr, is "Thinking back over the last four weeks, how many times (if any) have you had five or more drinks on one occasion? (A ‘drink’ is one pint/bottle/can of beer or cider, 2 alcopops, one small glass of wine, a single measure of spirits)."
https://www.understandingsociety.ac.uk/sites/default/files/downloads/documentation/mainstage/questionnaire/wave-2/Wave_2_Youth_self-completion_with_variable_names.pdf?q=8d03a3e8095f394413fa458e45393a665e1c2ea6
This follow up question is not asked in odd numbered waves, which is why the sixth response option does not appear in data from those waves.
Around 97-98% of the responses to the follow up question are "none" if their answer to the previous question was "never", so I would think these can be reasonably combined with response 5 at ypdklm. You will need to decide how to treat the other responses depending on your research question.
Best wishes,
Stephanie
Thanks Stephanie, that resolves my query!
Best wishes,
Amy
Dear Stephanie,
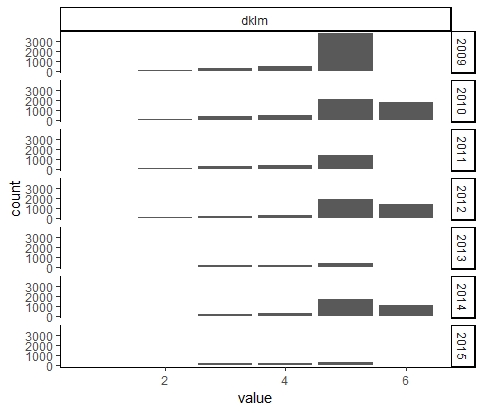
Actually I have another question. See attached, the distribution shows that dklm has a lot more missing values in 2011, 2013 and 2015. I have a feeling it has something to do with ypregalco, but I am not sure why this only occurs in certain years as ypregalco is asked every year.
Best wishes,
Amy
Dear Amy,
If you read the questionnaires you will see that these missing answers are due to routing at ypeveralc. Waves 3, 5 and 7 included an additional question, ypregalco, and routing around that and ypdklm if the answer to ypeveralc was no. Waves 1, 2, 4, 6 and 8 did not include that routing so respondents answered ypdklm regardless of their answer to ypeveralc. This has been corrected for future waves. As in my previous answer, if someone has answered that they have never had an alcoholic drink and then answered ypdklm with "never" then these could be grouped with those who answered that they have never had an alcoholic drink and skipped ypdklm due to the routing.
Best wishes,
Stephanie
- Status changed from Feedback to Resolved
- % Done changed from 80 to 100
Also available in: Atom
PDF

 Updated by Stephanie Auty
  Updated by
  Updated by
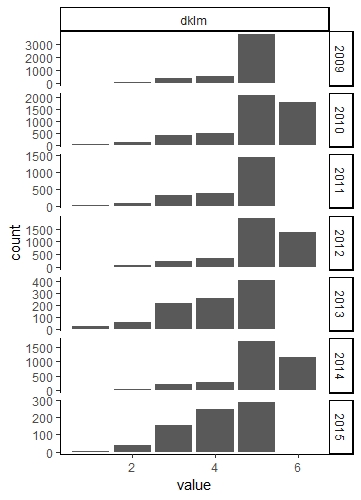