Support #2236
open
Problems with partner's information
100%
Description
Dear colleagues,
[I have previously posted this query as an extension (modification) of a previous one that was solved by Piotr but I thought it advisable to just make a new one out of it. Thanks for your attention]
I'm interested in matching partners' information on gender egalitarian values (scopfamb & scopfamf) and education (qfhigh_dv) to ego's information.
Yet, after retrieving partner's information, I'm getting some unsettling results, like the ones shown in the following table, where four groups created according to gender and level of education of the ego (only middle and highly educated are considered) is cross-tabulated with partner's level of education, considering here three possible categories: no partner, a partner less than HE (higher education) and a partner with higher education.
The results in the following table look as if women had more partners than men; or, putting it differently, as if the observations corresponding to individuals who appear as "no partner", partner with "less than HE" or partner with "Higher Educ" were mostly observations for women (either Mid or High) not for men.
. table gndr_educ_group _sp_highest_educ3 if highest_educ3 > 1, statistic(percent gndr_educ_group) nformat(%5.1f)
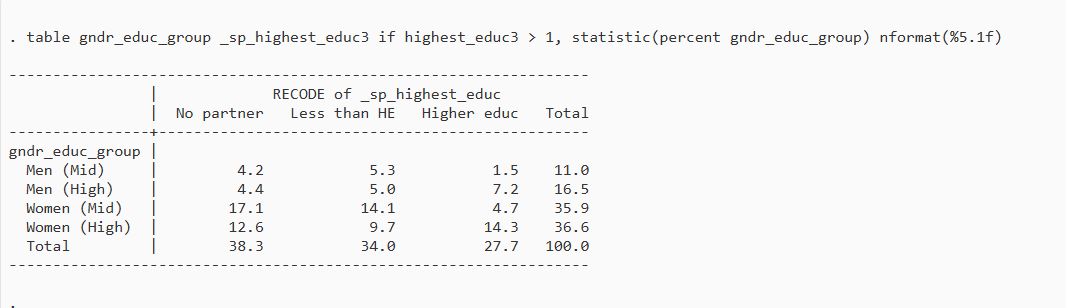
As I say, that's unsettling. We would like to know if we made any mistake in retrieving the partner's information or if the partner's data is more available for women than for men.
I have summarised the do-files that I've created for (a) compiling individual-level information of the 14 waves of the UKHLS, (b) retrieving and merging partner's information to the individual-level data created in the previous do-file and (c) creating the variables that participate in the table above. This is the last line in the third do-file.
My co-authors and I would greatly appreciate your help for solving this puzzle.
Thanks a lot for your attention and your invaluable help.
And kind regards
Luis Ortiz
Universitat Pompeu Fabra
Files
 Updated by Understanding Society User Support Team 11 months ago
- File UserForum_2236_shared.do UserForum_2236_shared.do added
- Status changed from New to Feedback
- % Done changed from 0 to 50
Hello Luis,
I have attempted to replicate this exercise (Stata syntax attached) for Wave 2. I too am getting higher no partner % for women than men but the discrepancy is not that big - men (2.3%) and women (4.9%). As attrition is higher among separated men, it makes sense that % no partner will be higher for women in the sample.
Please check the syntax I have attached and see if that does what you want to do. If not, please let me know and I will check again.
Hope this helps.
Best wishes,
Alita
Understanding Society User Support Team
Updated by Understanding Society User Support Team 11 months ago
- Private changed from Yes to No
 Updated by Luis Ortiz 11 months ago
Many thanks for your swift attention to our query, Alita...¡
Your answer is reassuring. The explanation provided for the higher no partner % information for women than for men is very informative. We did not know that attrition among single separated men was higher.
Best wishes and many thanks again
Luis
Updated by Understanding Society User Support Team 7 months ago
- Status changed from Feedback to Resolved
- % Done changed from 50 to 100