Support #1702
open
Wave 4 GHQ scores
100%
Description
Hello
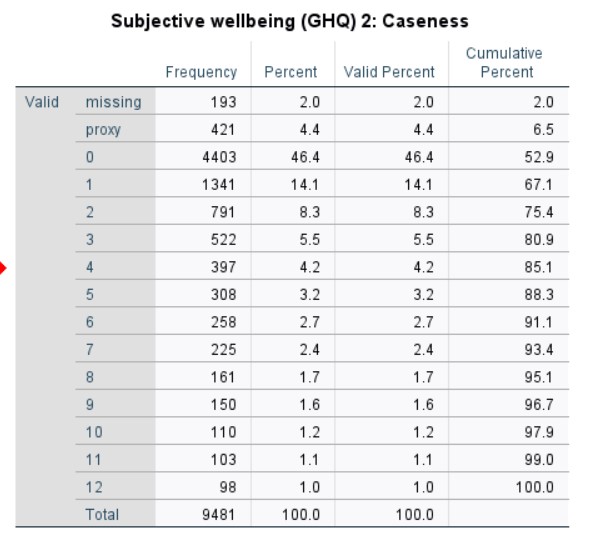
I'm trying to understand the reason for what seems to be a very different distribution of the w_scghq1_dv and w_scghq2_dv variables on mental health for the BHPS wave 4 in comparison to all the other waves.
I've noted that there is a lot of "proxy" data (-7) for this wave but not for other early waves - why is this the case? Was the survey administered differently in wave 4 in some way?
Is there any systematic reason why the people who did not fill in the self-completion questionnaire in this wave would have poorer mental health than people who did complete it?
Hope you can help!
Many thanks
Emily
Files
 Updated by Understanding Society User Support Team almost 4 years ago
- Category set to Data inconsistency
- Status changed from New to In Progress
- Private changed from Yes to No
Many thanks for your enquiry. The Understanding Society team is looking into it and we will get back to you as soon as we can.
We aim to respond to simple queries within 48 hours and more complex issues within 7 working days.
Best wishes,
Understanding Society User Support Team
Updated by Understanding Society User Support Team almost 4 years ago
- Status changed from In Progress to Feedback
- % Done changed from 0 to 20
Hi Emily,
I have compared the distribution of these variables in wave 4 BPHS to waves 3 and 6 of the BHPS and haven't found any anomalies, the distributions are very similar. Would you be able to paste a table(s) or graph(s) illustrating the discrepancy you have found? Also, please include the information on the version of the data (whether the original BHPS or harmonised) and the release of the data you are using.
Best wishes,
Understanding Society User Support Team
 Updated by Emily Humphreys almost 4 years ago
- File scghq2.txt scghq2.txt added
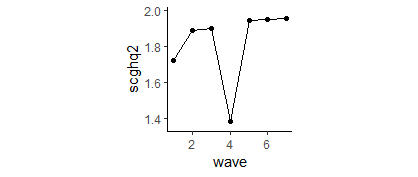
- File mean_SCGHQ2_w1to7.png mean_SCGHQ2_w1to7.png added
Thanks for your help. This shows waves 1-7 and is from the harmonised version (release that includes Understanding Society data up to 2020). No weights applied. First row is the wave number and first column is the derived variable score. From this, it looks like lots more missing data in this wave, and a different distribution even after excluding missing cases. Perhaps I've made a mistake with my code?
Emily
Updated by Emily Humphreys almost 4 years ago
Sorry, I should say - in case it's not obvious - that the missing data discrepancy is in the "inapplicable" category (-8) rather than the "proxy" (-7) category as I said previously.
Updated by Understanding Society User Support Team almost 4 years ago
- File bd_scghq2_dv.jpg bd_scghq2_dv.jpg added
Hi Emily,
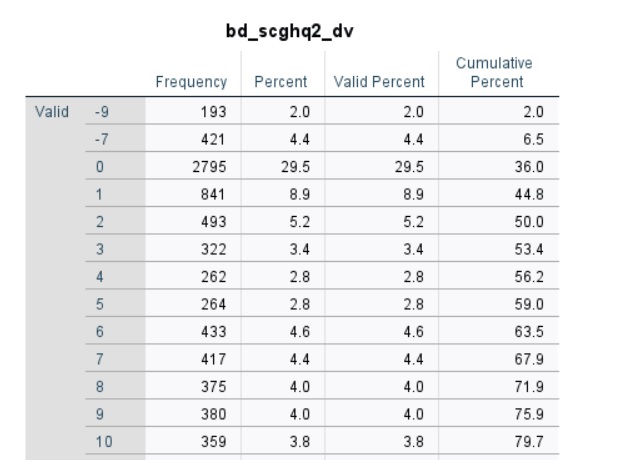
Thank you, I'm attaching the distribution of the bd_scghq2_dv in wave 4 of the BPHS. As you can see, the distribution is different than in your summary. However, I get the same numbers for that variable for waves 3 and 5. I suspect we might be using different releases of the data, I'm using the 15th edition (March 2022). There might have been an error in the earlier releases which has been corrected in the most recent release, hence the discrepancy. Could you please check which version you are using? You can find this information in the read6614.html file in the data folder you downloaded from the UK Data Service website.
Best wishes,
Understanding Society User Support Team
Updated by Emily Humphreys almost 4 years ago
Hello
That's really strange - my read6614 file also refers to the 15th edition so this should be the same data. I don't think it can be my code as I've tried it a few different ways (including reading in the data again), and it's only an issue with wave 4. Is there anything else I could try?
Emily
Updated by Understanding Society User Support Team almost 4 years ago
Hi Emily,
Which software version of the data are you using? Stata, SPSS or Tab?
Best wishes,
Understanding Society User Support Team
Updated by Emily Humphreys almost 4 years ago
Hello
I'm using R, so it's the tab files.
I also picked up that the weighting variables don't seem to be included in the individual respondent files (or perhaps don't have the same names as in the user manuals?)
Thanks
Emily
Updated by Understanding Society User Support Team almost 4 years ago
- % Done changed from 20 to 50
Hi Emily,
So this might be the reason behind the difference, I was using SPSS and Stata. I'll investigate this further and try to find out why the Tab version is different, I'll let you know when I learn something.
However, in the meantime, you can also consider using the Stata (or SPSS) version of the data and deploying some R packages to read in the data, like foreign or haven. You can check our online R Moodle course available here https://www.understandingsociety.ac.uk/help/training/online/introduction-course . It includes files with code showing how to work with UKHLS data read in from Stata files.
Best wishes,
Understanding Society User Support Team
Updated by Understanding Society User Support Team almost 4 years ago
Hi Emily,
We've had another look at the most up-to-date tab data on the UKDS website and the distribution of bd_cghq1_dv and bd_scghq2_dv is identical to that in the sav and dta files, so my guess it that the problem might have been already solved. Could you try to download the data from here: https://beta.ukdataservice.ac.uk/datacatalogue/studies/study?id=6614 and produce the table again?
Best wishes,
Understanding Society User Support Team
Updated by Emily Humphreys over 3 years ago
Hello
Thanks again for your help and apologies for delay - I've been away for a couple of weeks.
I've redownloaded and rerun the analysis, and am still getting the same problem. In case it helps, the code I'm using for the frequency table is:
write.table(with(bd_indresp, table(bd_scghq2_dv)))
In the meantime I'm happy to switch to the stata version and read in the data, so it won't hold up my project; I just want to make sure there isn't a systematic issue.
Thanks
Emily
Updated by Understanding Society User Support Team over 3 years ago
Dear Emily,
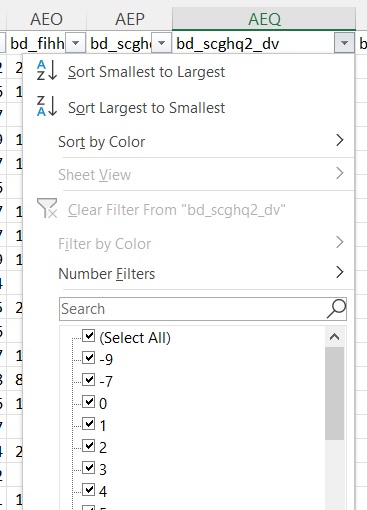
I downloaded the data on the 7th of June from here: https://beta.ukdataservice.ac.uk/datacatalogue/studies/study?id=6614 I don't use R, so I'm unable to check using your code, but when I import the TAB file using Excel and SPSS there are no -8s for bd_scghq2_dv, please see the screens attached. Maybe something happens when you read in the TAB data in R? My suggestion is you use Excel to check this in a similar way I did (or some other software able to read in and visualise tab delimited text data) and, if you would rule out the data issue, look for possible errors in reading the data in R.
Best wishes,
Understanding Society User Support Team
Updated by Understanding Society User Support Team over 2 years ago
- Status changed from Feedback to Resolved
- % Done changed from 50 to 100