Support #2107
open
Query related to Understanding society data (UKHLS)
100%
Description
Dear Madam/Sir,
I hope this mail finds you well.
My name is Dr Saddaf Naaz Akhtar, a research fellow at the University of Southampton. I would like to inform you that I am using the understanding society data. I have two queries are as follow:
1. In the wave 6, the variable "jbpen": (pension-employer runs a pension scheme), the proportion of employer runs a pension scheme is very low compared to the all there wave. In case of trend analysis, there is a striking drop down in the wave 6. Can you please explain why? or any possible reasons. Is there any change in survey design?
2. The variable total earrings "prearn" shows more than 98% inapplicable categories in all the wave. Can you please explain why? And I want to calculate the average earnings annually and average earnings weekly.
Thank you.
Kind regards,
Saddaf
Files
 Updated by Understanding Society User Support Team almost 2 years ago
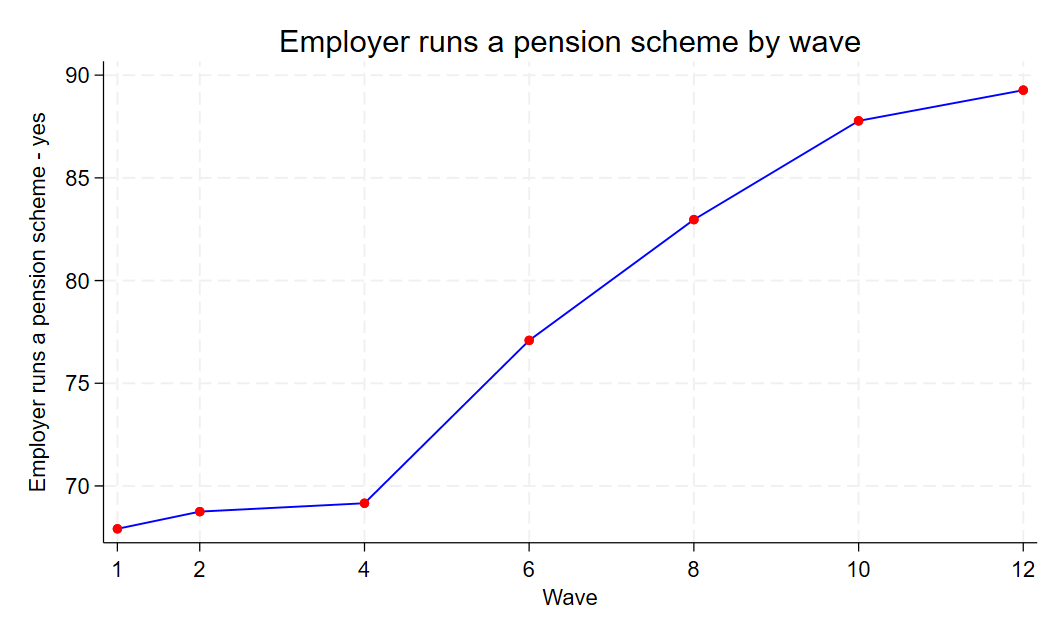
- File Employer runs a pension scheme by wave.png Employer runs a pension scheme by wave.png added
- File jbpen_forum.do jbpen_forum.do added
- Priority changed from Urgent to Normal
- % Done changed from 0 to 80
Dear Saadaf,
1. I checked the frequencies for jbpen and I couldn't find a drop in wave 6 (see the figure attached).
2. This is because this question is asked only of proxy respondents (Sometimes when a person cannot participate in the interview, someone else in the household (generally their spouse or partner or adult children) answers questions on their behalf, that is, by proxy. This questionnaire is a much shorter questionnaire asking factual information.)
Please check the list of available income variables here https://www.understandingsociety.ac.uk/documentation/mainstage/user-guides/main-survey-user-guide/derived-income-variables/, you might also want to have a look at this paper https://understandingsociety.ac.uk/wp-content/uploads/working-papers/2019-08.pdf
I hope it helps.
Best wishes,
Piotr Marzec
UKHLS User Support
 Updated by Saddaf Naaz Akhtar almost 2 years ago
Dear Piotr,
Thank you very much for the quick response.
1. I have added filter with the variable "jbpen": (pension-employer runs a pension scheme).
jbhas==1 (Those who are in paid work last week)
then
jbsemp==1 (Those who are paid in last week and employee)
and then...
jbpen==1
then I am cross tabulating with waves (sorting by ethnicity).
The trend line says that there is a drop in wave 6
Updated by Saddaf Naaz Akhtar almost 2 years ago
Dear Piotr,
I forgot to inform you that I am looking for 45-64 years adults. Please use this filter too.
Thank you.
Updated by Understanding Society User Support Team almost 2 years ago
- Private changed from Yes to No
Dear Saddaf,
Would you be able to share with me your output and the code creating it, please? I want to make sure we are looking at the same results.
Many thanks,
Piotr
UKHLS User Support
Updated by Understanding Society User Support Team almost 2 years ago
- Status changed from New to Feedback
Updated by Saddaf Naaz Akhtar almost 2 years ago
- File wave 6 query.do wave 6 query.do added
Dear Piotr,
The do file is attached to this mail.
Please find the attachment.
Thank you.
Kind regards,
Saddaf
Updated by Understanding Society User Support Team almost 2 years ago
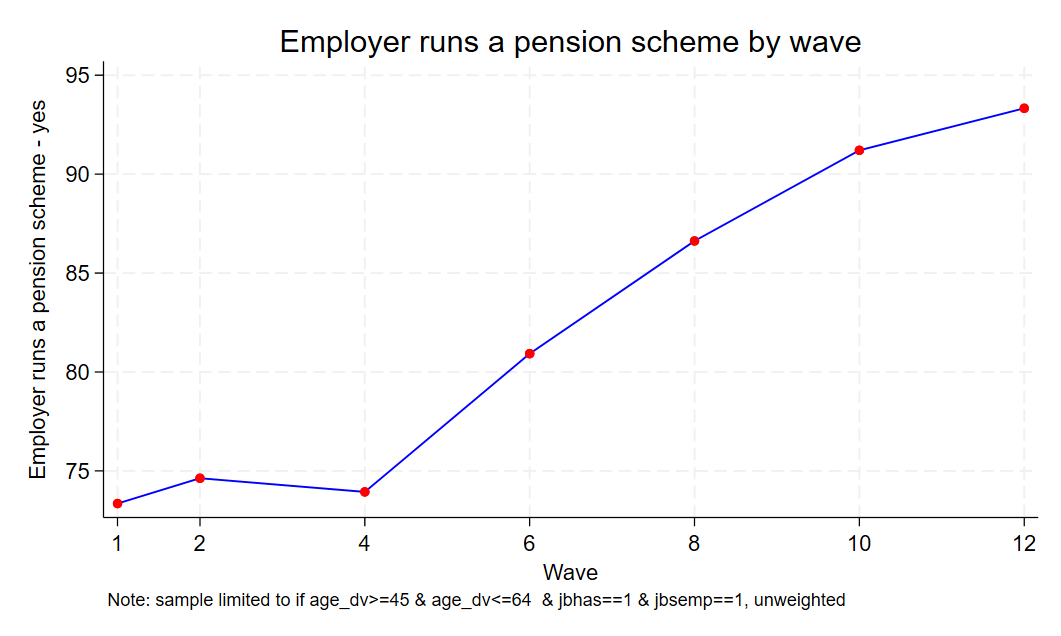
- File fig 1. jbpen by wave_filtered sample_unweighted.png fig 1. jbpen by wave_filtered sample_unweighted.png added
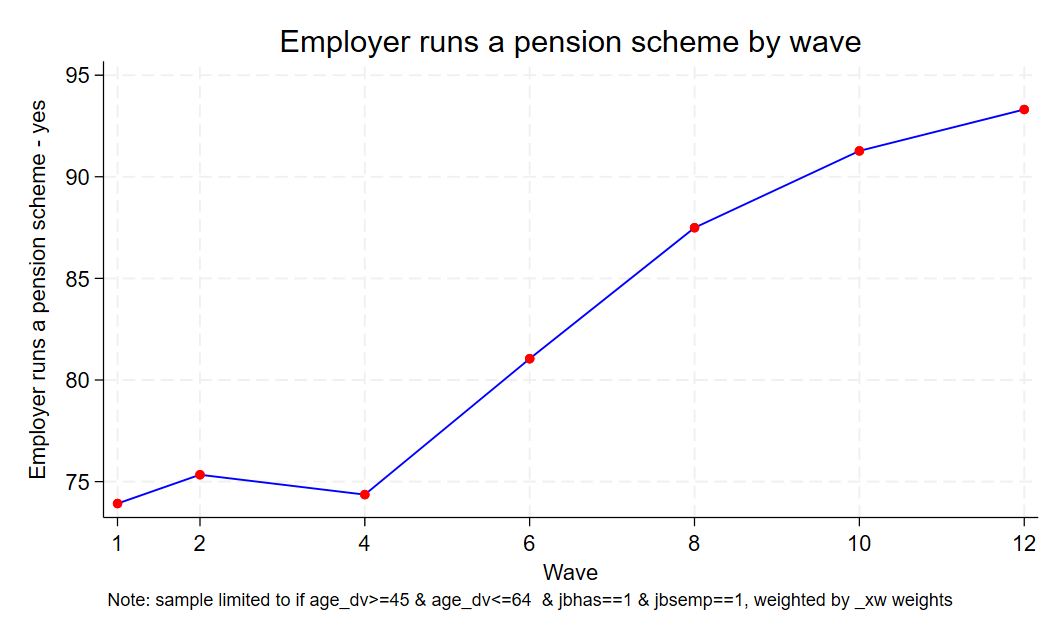
- File fig 2. jbpen by wave_filtered sample_weighted.png fig 2. jbpen by wave_filtered sample_weighted.png added
- File fig 3. jbpen by waveðnicity_filtered sample_unweighted.png fig 3. jbpen by waveðnicity_filtered sample_unweighted.png added
- File jbpen_forum2.do jbpen_forum2.do added
Dear Saddaf,
I'm not sure which part of your syntax shows the issue, but I think that the last command in the file will not show you the correct results since it includes in the calculation the zeros from the waves in which this question was not asked. I checked the frequencies with your filters on and haven't found a drop in wave 6 (Figs. 2 and 3). You mentioned ethnicity in your post, so I also checked the jbpen distribution, including a breakdown by ethnicity (Fig. 3), and the overall increasing trend still holds. If you need population estimates, you'll need to weight the data in Figure 3, though you need to remember that the sample sizes for some groups with the filters on are tiny and so the point estimates can be inaccurate.
I hope this answers your question.
Best wishes,
Piotr Marzec,
UKHLS User Support
Updated by Saddaf Naaz Akhtar almost 2 years ago
Dear Piotr,
Thank you very much for all your hard work. I have corrected my estimates.
Many thanks.
Kind regards,
Saddaf
Updated by Understanding Society User Support Team almost 2 years ago
- % Done changed from 80 to 90
Dear Saddaf,
Great! I am glad the issue has been resolved and my answer is helpful.
Best wishes,
Piotr
Updated by Saddaf Naaz Akhtar almost 2 years ago
Dear Piotr,
Thank you very much.
Great help.
Kind regards,
Saddaf
Updated by Understanding Society User Support Team over 1 year ago
- Status changed from Feedback to Resolved
- % Done changed from 90 to 100