Support #1985
open
Representativeness of housing tenure (tenure_dv)
100%
Description
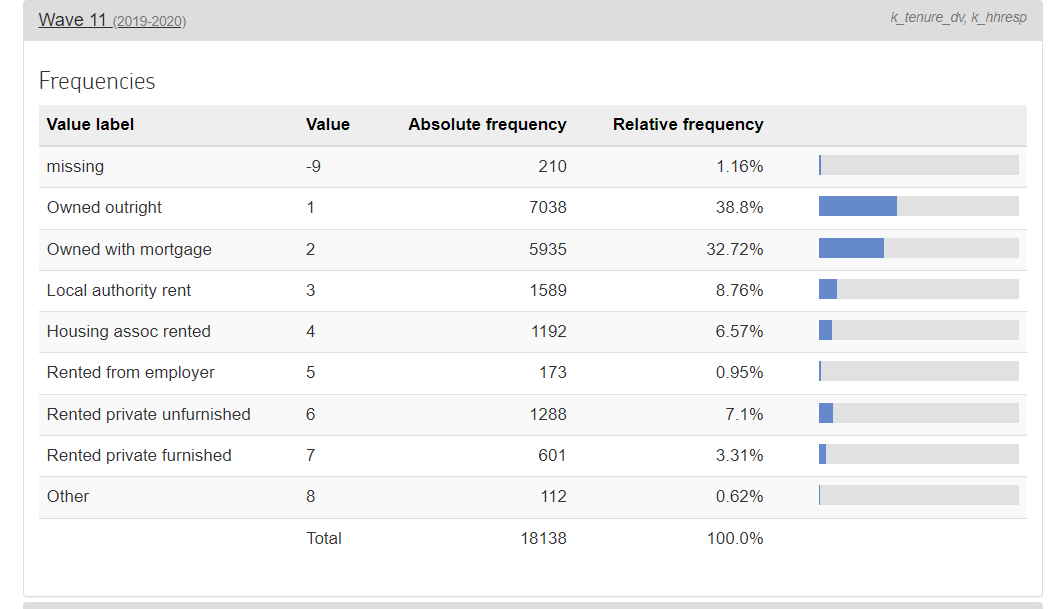
I am looking at wave 11 responses in the hhresp table for the breakdown of housing tenure (tenure_dv) at the household level.
The screenshots attached include the % of each category (unweighted and weighted using "hhdenui_xw").
Comparing these figures with census results for tenure status in England and Wales (% of households by tenure), it appears that the number of private renters (in USoc "Rented private unfurnished" and "Rented private furnished" appears to be under represented (11.7% when weighted) relative to the census figures for England and Wales in 2021 (20.3%). I have tried limiting the USoc sample to just England and Wales household, but it does not materially change the results.
Link to census data here: https://www.ons.gov.uk/peoplepopulationandcommunity/housing/bulletins/housingenglandandwales/census2021
Any info on why I may be finding this discrepancy would be very much appreciated.
Files
 Updated by Understanding Society User Support Team over 2 years ago
- % Done changed from 0 to 10
Many thanks for your enquiry. We will look into this and get back to you.
Best wishes,
Understanding Society User Support Team
 Updated by Olena Kaminska over 2 years ago
Dear Eoghan,
Thank you for your question. I am not an expert in the field, but looking at the question for Census 2021 for England (H11 here file:///C:/Users/olena/Downloads/householdenglandpdf.pdf), the categories do not seem to correspond well with UKHLS. For rented properties, Census asks - part owns/ part rents, rents and lives here rent free. UKHLS has categories (from your figure): local authority rent, housing association rented, rented from employer, rented private unfurnished and furnished. You may know this better, but I feel that all of these are rented, and from your figure there would be 26.69%. Not sure where category 'other would belong, and how part rented / part owned in Census would correspond to these.
I think the issue you observe is related to the use of different definitions for 'rented' between Census and UKHLS.
Hope this helps,
Olena
Updated by Understanding Society User Support Team over 2 years ago
- Status changed from New to Feedback
- % Done changed from 10 to 50
- Private changed from Yes to No
Updated by Understanding Society User Support Team over 2 years ago
- Status changed from Feedback to Resolved
- % Done changed from 50 to 100